Using Facebook's Prophet Tool on Crime Data
Table of Contents
Interesting Recent Data Science Consulting Work #
I recently had the opportunity to do some consulting data science work for the National Network for Safe Communities at John Jay College. Our team worked on several interesting projects including natural language processing on news articles to determine relevance to domestic violence cases, web scraping of news sites, improvement of their database system, and analysis of crime data. I want to focus here on two sub-projects on which I took the lead: intervention analysis and proof of concept of applying Facebook’s Prophet time-series analysis tool to crime data.
Intervention Analysis #
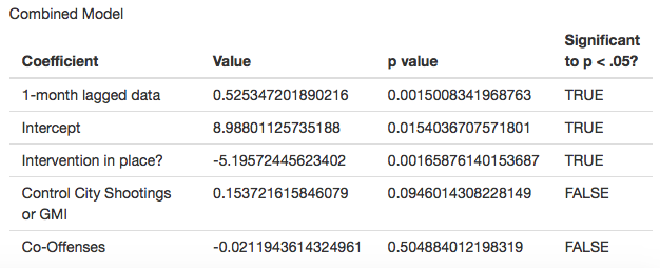
Intervention Analysis is an established data science technique that determines if an intervention (some variable that is 0 for a portion of the observation of some dependent variable, say crime rates, then 1 for the remainder of the observation period) has a statistically significant effect on a dependent, time-series, variable. For instance, NNSC might be interested in determining if some crime-reduction initiative had an effect on violent crime after it was implemented. Here is a paper that gives a good technical definition of intervention analysis. The basic idea is to create a linear ARIMA model, which is an auto-regressive and moving average model that may also include a differentiating step to deal with stationarity violations, and include other relevant predictors such as crime in a control population, and a Boolean column for the intervention. After fitting the linear model, you can see if the intervention columns is significant to a given p value. A very simple intervention analysis is just a 1st degree auto-regressive model with given controls and the intervention column.
NNSC wanted me to reproduce the simple intervention analysis presented in this paper by Yale researchers that argues that a crime-reduction initiative in New Haven a few years ago was successful. I closely reproduced the analysis (my final p values were slightly different because I was missing some data and had to impute, see comments in code for details). NNSC also asked me to determine how applicable this type of analysis would be to similar projects. The answer is “very.” This is a respected technique that basically determines the statistical significance of an intervention. I created a Shiny app that makes doing this type of analysis automatic if the user throws relevant new data into an easy-to-use csv file. Check out the repo for the code.
However, drawing any conclusions from this analysis requires a trained data scientist, in my opinion, and I am not sure to what degree I agree with even the Yale researchers in the earlier linked paper. For one, you ought to be confident that your data meets the assumptions of the ARIMA model you choose to fit. The Yale researchers choose a 1-degree AR model without apparently testing for stationarity. How did they settle on no moving average or differentiating components? There is an argument for this for a simple significance test, my point is that a user should be aware of all these things before using my tool blindly. Secondly, the intervention could have an effect that is not so “Boolean” that a simple coefficient can be attached to the Boolean variable in the model. For instance, it might have a large effect that then fades over time. Finally, you might always get a random false positive when using statistical significance tests. You can even see this in my tool by randomly changing the intervention start date and observing how many positive you see. Observation windows are also observed to have an effect.
The real value-add of a data scientist is not that he or she can plug and play these significance tests, but that they have the mathematical background to know the questions to ask of the data before running any tests, and to tell an honest story about what test results might, or might not, mean.
Facebook’s Prophet Tool #
In the spirit of the above monologue on the value of a data scientist, I tried exploring some other models that might be useful to NNSC. I ruled out neural networks due to lack of interpretability. However, I’ve recently spent some time on time-series neural networks and hope to post something about the exploration I’ve been doing on in that area soon.
The white paper on Prophet is pretty easy to understand. Basically, it’s a piece-wise linear model with seasonality (that is, a periodic component is added to the base linear model) and holidays (Boolean holiday variables added in). It’s the fasted way I’ve found to quickly create a model with additive (you can also do multiplicative) periodic components. Facebook made this tool because they found that this type of model fits a lot of business applications, and it’s not hard to see why. You have an underlying trend, a seasonal swing in sale (or whatever you are measuring) and predictable spikes or dips based on extraordinary events (holidays). You can tell it where to fit the piece-wise linear model, or how many pieces to use, or it can fit all that for you. You can also tell it which frequencies to consider for the seasonality components. It automatically picks yearly and weekly seasonality and gets the amplitude using Fourier analysis. It’s easy to view a nice graph of just the fitted seasonal component, which is great of narrative-building. The user chooses how many terms in the Fourier sum to include. More data allows more terms to be meaningful.
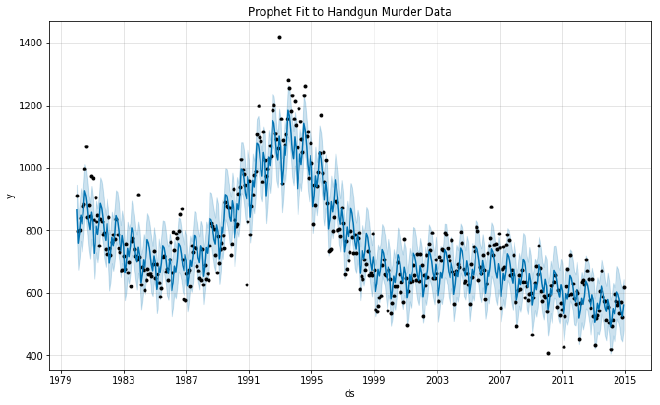
Another team member scraped the FBI database of all crime reports from all cities since the 80s. For proof of concept, I decided to model monthly national handgun crime rates using Prophet.
Before fitting, I used a Fourier Transform to see if there were any spikes at any frequencies so that I could tell Prophet what kind of seasonality to model. I fitted a nonseasonal Prophet model and subtracted that from the data before applying the Fourier transform to attempt to remove underlying trends to get a better picture of the possible period data.
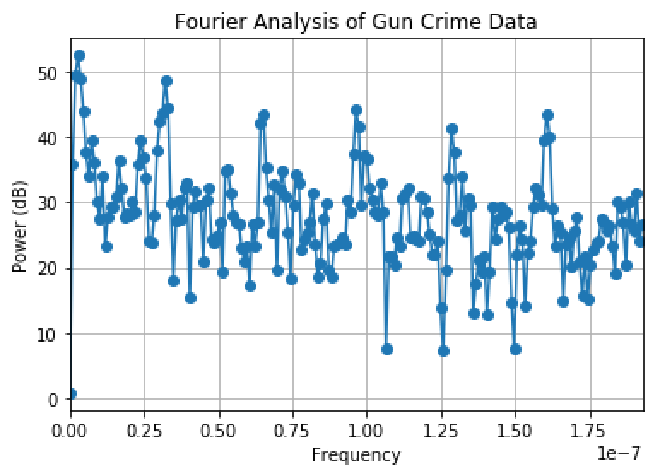
There is a spike right around the monthly frequency that corresponds to a period of 1 year, as well as spikes at multiples of that frequency. Therefore, I believed it was appropriate to have Prophet fit to yearly seasonality and that there were no other seasonalities I needed to consider. This the data has only monthly resolution so I only used the first 4 terms of the Fourier Series. I empirically settled on using an additive seasonality model rather than multiplicative.
Here is the fitted model with the data.
My goal was to get a visual representation of the underlying changes in handgun crime after separating out the yearly cycle. Prophet lets you easy examine the individual components:
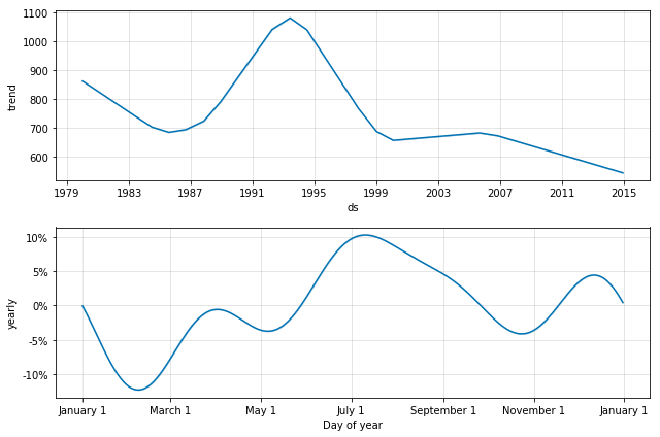
NNSC let me know that these results support the literature. Crime tends to rise in the summer. The long-term pattern is also consistent with other research.
This proof of concept demonstrated another value-add of a data scientist. Exploratory data science can help with narrative constructions, and model-fitting can help inform research and policy on specific data sets. In the future, I would like to apply Prophet to something more specific than nationwide handgun crime and compare the model to a sociologists understanding of the domain given their research.
Depending on the research domain, limiting the number of pieces in the piece-wise model or testing specific dates could further help with narrative construction or testing the commonly accepted narrative.
I implemented all of this in an IPython notebook and pushed it to Github.